

A new computer model suggests that Antarctica’s Thwaites Glacier could add more to sea-level rise by the end of this century than some earlier estimates. In some simulations, its contribution was as much as twice the current projections.
The model was developed by NASA’s Jet Propulsion Laboratory (JPL) in California, with the University of California, Irvine, and Dartmouth College. The study was published on 12 October in the journal Nature Communications, and NASA wrote about it on 20 October.
The idea: a zone, not a line
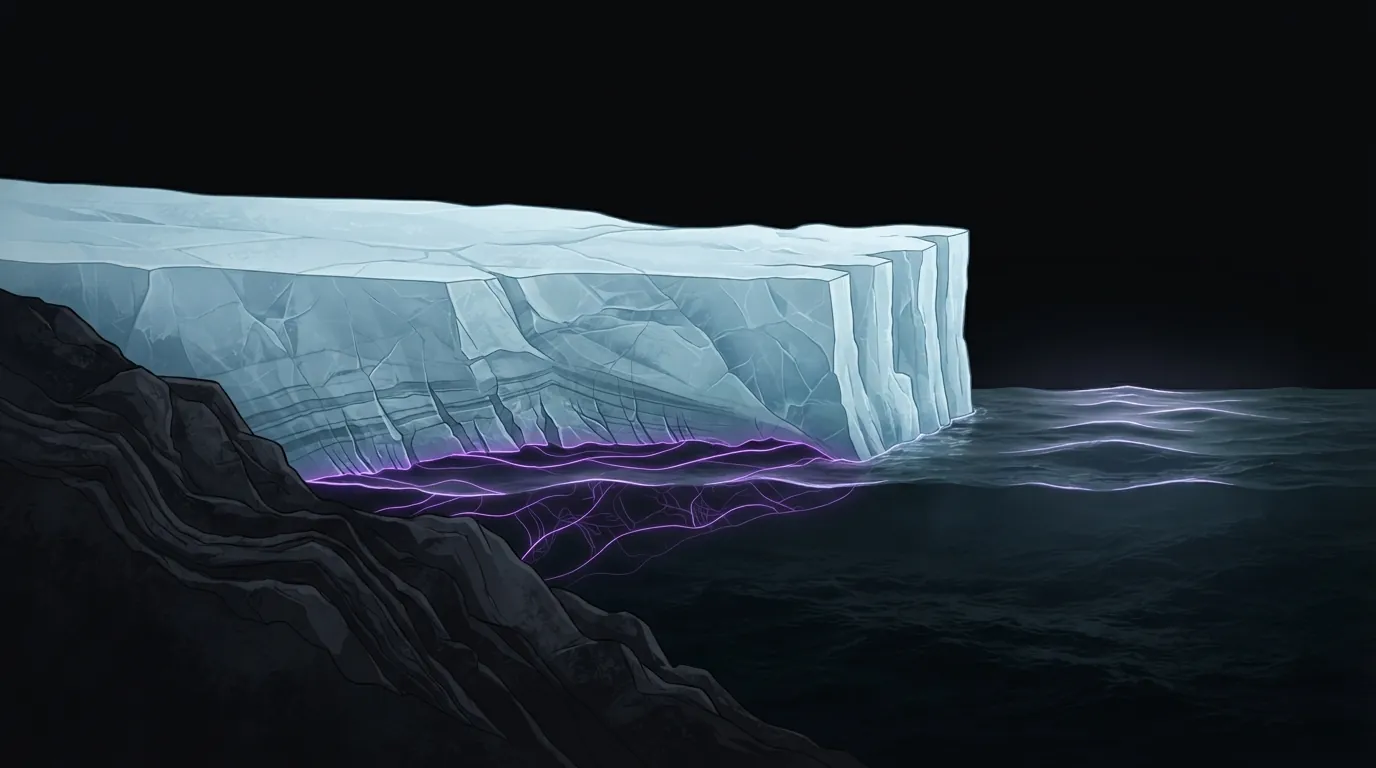
Thwaites is a glacier in Antarctica. Its ice rests on land for much of its length and then begins to float. The place where it stops resting on the ground and starts to float is called the grounding line.
Many ice-sheet models treat that transition as a sharp boundary, a single line. The new model treats it as a grounding zone: an area where seawater can seep several miles under ice that is still resting on the ground, according to NASA.
That matters for two reasons the study describes. Tides lift the ice in this zone, which can create instabilities. And the seawater that gets in brings warmth to the grounded ice, which speeds up melting and can destabilise the glacier more than a single line would allow.
Does it match what satellites see?
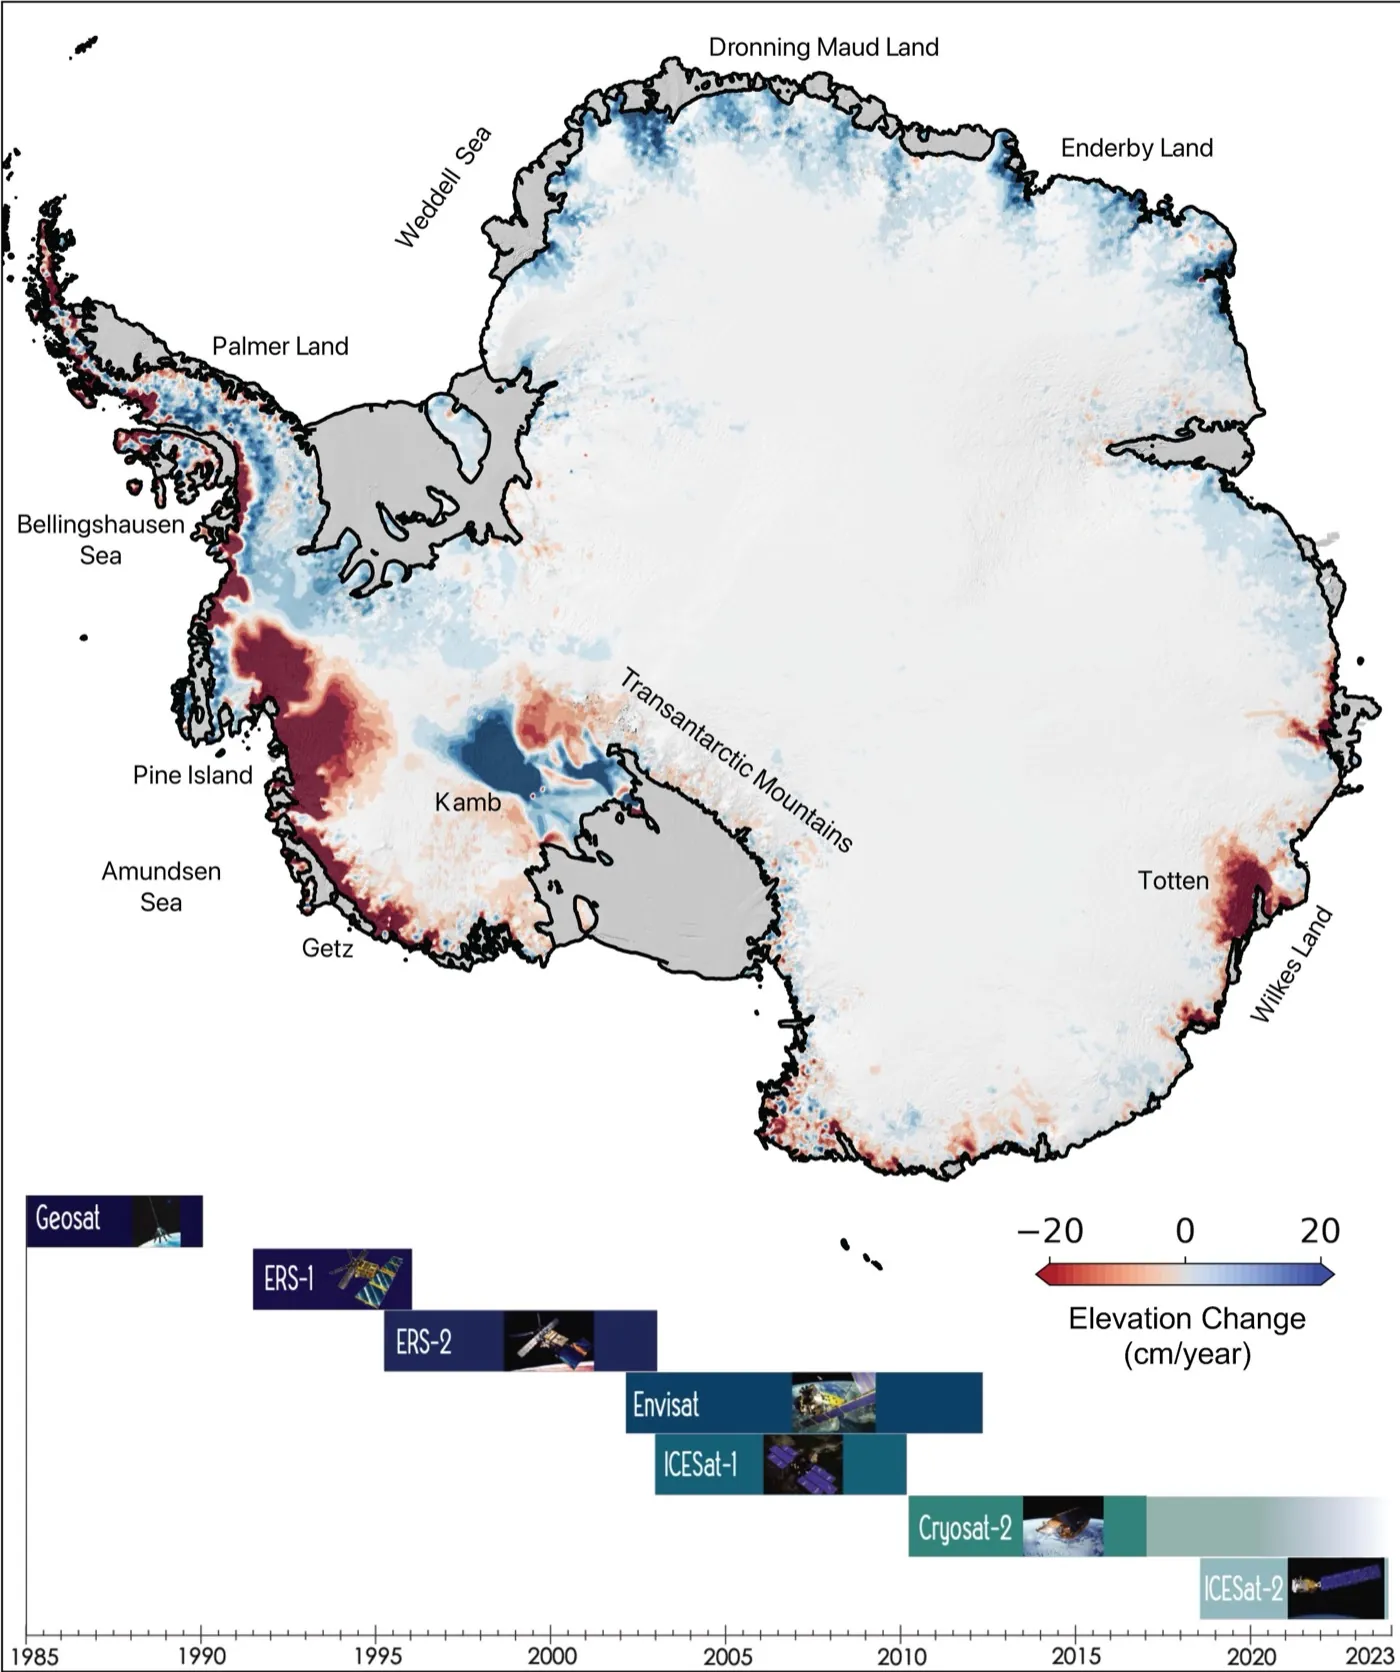
The researchers tested the model against satellite observations of the glacier’s retreat going back to the 1990s. They found that including grounding zones improved the simulation. According to NASA, the model matched the historical data four times more closely than models that leave grounding zones out.
NASA’s article does not say which satellites were used, or what measure of “closeness” the researchers applied. We would need the paper to answer that.
How to read “up to twice”
The headline number is easy to misread. NASA says that, in some simulations, the glacier’s contribution to sea level was up to twice the current projections. That is not a forecast that sea levels will rise twice as fast, and it does not apply to every simulation.
The NASA text also says the glacier “could” contribute more than some earlier estimates. The wording is careful because projecting a glacier’s long-term effect is hard. NASA says so itself, pointing to the complexity of the processes involved.
What the article does not tell us
NASA’s text gives no figures for sea-level rise, in millimetres or metres. It does not say which emissions scenarios were used or which earlier estimates the model is compared with. It does not name the researchers, the model or the funders.
Some press coverage we saw in search results gives specific numbers. We have not opened those reports or the paper, so we are not repeating them here. The same coverage often calls Thwaites the “doomsday glacier”, a label we avoid because it says more about drama than about the science.
Why it matters
The researchers say the model could give more reliable information about how glaciers behave, which in turn could help coastal regions that are most exposed to higher seas to plan. That is a stated hope, not a result: a better model does not by itself tell a city how much water to expect.
For now, the useful takeaway is narrow. A NASA-backed model that represents the glacier’s base more realistically fits past observations better, and in some runs it points to a bigger contribution to sea level. Whether other models reproduce that, and what the numbers look like in the paper, are the next things to check. We will update this article when we have read it.

Leave a Reply